Risks & Costs Services
Benefit from our tools and insights without having to do the work.


Lane Risk Assessment
Quantify the risk of temperature excursions during shipping.
Generation of Digital Twin
The shipping system plays a vital role in risks during shipments. We therefore first create digital twins of your given packaging options.
Definition of Shipping Lanes
Depending on where your shipments will be going, we create the digital shipping lanes. Stop-overs, temperature-controlled time intervals, direct solar irradiance during tarmac, etc. will all be included.
Definition of ATPs
Based on the shipping lanes and globally recorded weather data, we calculate ambient temperature profiles. We can provide monthly worst case ATPs, extreme profiles, such as minimum and maximum temperatures, and also daily profiles for every single day of the year.
Assessment of Lane Risk
We digitally send your packaging solutions down the shipping lanes, exposing them digitally to the ATPs. We then analyze how many shipments would have been successful, and how many profiles would have led to a temperature excursion for the different packaging options. This is a robust proxy for failure rate and excursion risk.
Determination of Best Packaging Option
The risk of temperature excursions will most probably vary, depending on the month of year and your packaging option. Based on the simulation results, you are empowered to take a data-based decision on which packaging option is the best for each season.

Cost Optimization
Determine the safest, yet cheapest packaging option.
Safe... and Cheap!
The safest shipping system is probably not what you are looking for. Otherwise we would send around actively cooled refrigerators. It is probably the safest and cheapest option that you are looking for.
Total Cost of Ownership
The Total Cost of Ownership (TCO) analysis includes all the different cost factors related to temperature excursions. By balancing the costs of the packaging and lane service level, and costs of CAPA analysis and product loss, you will find the best cost-effective solution. And all this digitally, prior to any phyiscal shipment!
Monthly Breakdown
Our TCO analysis provides you with a monthly cost breakdown. If your processes allow for switching of packaging solutions on a seasonal or monthly basis, you are enabled to choose the optimum solution for each time of year individually.

Carbon Footprint Calculation
Evaluate the carbon footprint equivalent generated from your shipping processes and reduce your GHG emissions.
Compliant, Cost-Effective and Greener
Except for quantifying excursion risk and total cost, we can calculate the carbon footprint equivalent for each shipping scenario. This enables process-related decisions that can lead to smaller environmental impact.
Our methodology utilizes European Standard EN 16258 and GLEC Framework.
Consider All Contributing Factors
We analyze multiple factors of the shipping process contributing to the total carbon footprint.
For instance, the selected container system, shipping lane and strategy followed are all good examples of factors that can have major impact on the resulting CO2e amount.
Investigate Shipping Scenario Impact
"Which compliant system considered has the smallest embodied carbon content? For this particular lane, will a single- or re-use system produce less emissions? How does the carbon footprint change if we ship with air instead of ocean?"
We can answer these and more questions regarding different shipping scenarios.

Realistic Ambient Temperature Profiles
Get ATPs representing the actual temperatures along a lane.
The Downside of Generic ATPs
Generic profiles are often used to represent the ambient temperatures on any shipping route within a specific, generally very large area. Within this area, the temperatures most probably vary, due to differences in altitude, water resources, weather phenomena, etc. Generic profiles should therefore be used with caution, as they do not represent reality.
Individual Shipping Lanes and ATPs
On the contrary to generic profiles, we generate lane-specific ATPs. To do so, we only need to know the start and destination of your shipment. Based on your desired shipping routes, we then first define the more detailed shipping lane. It includes stop-over locations, warehouses, tarmac times, temperature-controlled lane segments, etc.
Generation of ATPs
With the defined shipping lanes, we then generate the lane-specific ATPs. We can either provide you with profiles based on historical data or forecasted data:
Historical data is based on data recorded by weather stations all across the globe. You can get deep insights in ATPs for all 365 days of the year, monthly minimum/maximum temperatures, and more.
With the forecasted data, you can obtain a predictive, data-based ATP for up to six days into the future.

Ocean Container Power Offs
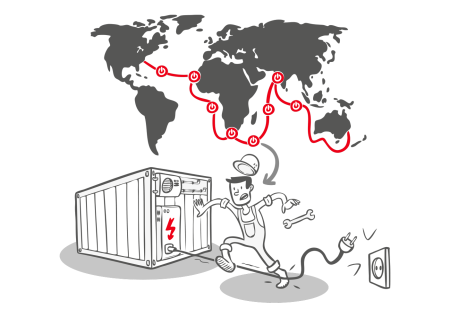
We analyze how long your product can retain its required temperature during a power-off.
Definition of Shipping Lane
Where will the container be shipped to? We first determine the details of your shipping lane, including possible phases of power-offs in ports.
Product Excursions
Based on the geographical location, we determine the temperature state of your product during the power-off intervals to identify potential temperature excursions.